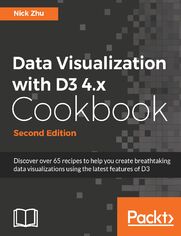
Data Visualization with D3 4.x Cookbook - Second Edition - Helion

Tytuł oryginału: Data Visualization with D3 4.x Cookbook - Second Edition
ISBN: 9781786469960
stron: 370, Format: ebook
Data wydania: 2017-02-28
Ksi─Ögarnia: Helion
Cena ksi─ů┼╝ki: 125,10 z┼é (poprzednio: 139,00 z┼é)
Oszczędzasz: 10% (-13,90 zł)
Discover over 65 recipes to help you create breathtaking data visualizations using the latest features of D3
About This Book
- Learn about D3 4.0 from the inside out and master its new features
- Utilize D3 packages to generate graphs, manipulate data, and create beautiful presentations
- Solve real-world visualization problems with the help of practical recipes
Who This Book Is For
If you are a developer familiar with HTML, CSS, and JavaScript, and you wish to get the most out of D3, then this book is for you. This book can serve as a desktop quick-reference guide for experienced data visualization developers. You'll also find this book useful if you're a D3 user who wants to take advantage of the new features introduced in D3 4.0. You should have previous experience with D3.
What You Will Learn
- Get a solid understanding of the D3 fundamentals and idioms
- Use D3 to load, manipulate, and map data to any kind of visual representation on the web
- Create data-driven dynamic visualizations that update as the data does
- Leverage the various modules provided by D3 to create sophisticated, dynamic, and interactive charts and graphics
- Create data-driven transitions and animations within your visualizations
- Understand and leverage more advanced concepts such as force, touch, and Geo data visualizations
In Detail
This book gives you all the guidance you need to start creating modern data visualizations with D3 4.x that take advantage of the latest capabilities of JavaScript.
The book starts with the basic D3 structure and building blocks and quickly moves on to writing idiomatic D3-style JavaScript code. You will learn how to work with selection to target certain visual elements on the page, then you will see techniques to represent data both in programming constructs and its visual metaphor. You will learn how map values in your data domain to the visual domain using scales, and use the various shape functions supported by D3 to create SVG shapes in visualizations.
Moving on, you'll see how to use and customize various D3 axes and master transition to add bells and whistles to otherwise dry visualizations. You'll also learn to work with charts, hierarchy, graphs, and build interactive visualizations. Next you'll work with Force, which is one of the most awe-inspiring techniques you can add to your visualizations, and you'll implement a fully functional Choropleth map (a special purpose colored map) in D3.
Finally, you'll learn to unit test data visualization code and test-driven development in a visualization project so you know how to produce high-quality D3 code.
Style and approach
This step-by-step guide to mastering data visualizations with D3 will help you create amazing data visualizations with professional efficiency and precision. It is a solution-based guide in which you learn through practical recipes, illustrations, and code samples.
Osoby które kupowały "Data Visualization with D3 4.x Cookbook - Second Edition", wybierały także:
- Power BI Desktop. Kurs video. Wykorzystanie narzędzia w analizie i wizualizacji danych 335,45 zł, (36,90 zł -89%)
- Tabele i wykresy przestawne dla ka 199,00 zł, (69,65 zł -65%)
- Data Science w Pythonie. Kurs video. Przetwarzanie i analiza danych 149,00 zł, (67,05 zł -55%)
- Excel 2013. Kurs video. Poziom drugi. Przetwarzanie i analiza danych 79,00 zł, (35,55 zł -55%)
- Kompletny przewodnik po Power Query (M). Opanuj wykonywanie z 169,00 zł, (84,50 zł -50%)
Spis tre┼Ťci
Data Visualization with D3 4.x Cookbook. Visualization Strategies for Tackling Dirty Data - Second Edition eBook -- spis tre┼Ťci
- 1. Getting started with d3.js
- 2. Be selective
- 3. Dealing with data
- 4. Tipping the scales
- 5. Playing with the axes
- 6. Transition with Style
- 7. Getting into shape
- 8. Chart them up
- 9. Lay them out
- 10. Interacting with your visualization
- 11. Using force
- 12. Know your map
- 13. Test drive your visualization
- 14. Appendix A


